With the Intake Calculation function you can change parameters of a voyage to get an overview of quantities available for cargo at the port calls.
Click on a voyage in the list or board to open it in the drawer.
At the top right, click on Functions.
Select Voyage Intake Calculation.
At the top, below the vessel-chip and voyage reference, fields for changing the stowage and bunker properties for the entire voyage are displayed.
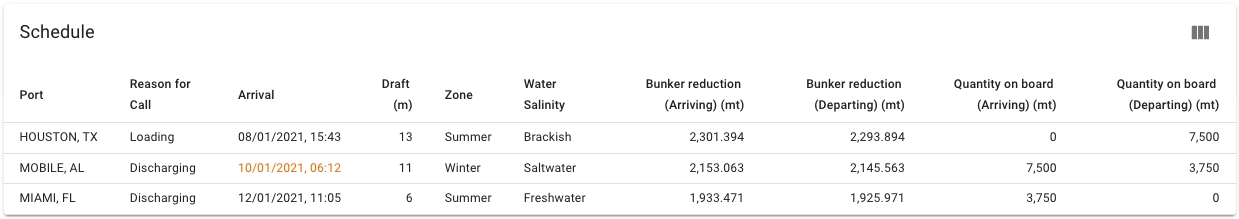
A table of all the port calls on this voyage is shown in this section. To change the intake reduction properties per port call, click a row to open a window where you can make adjustments. Some columns are hidden by default, and can be toggled on/off by using the "Customize Columns"-button in the top right corner of the table.
A mixed chart of the calculation results is generated at the bottom. Each port call has multiple graphs to show the reductions, cargo quantity and quantity available for cargo. The charts gets updated automatically when there are changes to the voyage header, port call, or vessel parameters.
Click on the legends at the top of the chart to toggle the display of a graph. Hover the mouse over the chart to inspect the values of each calculation data point.
The loadline information table shows data on the voyage that might affect the intake. To change these values, you need to edit the vessel in the Vessels module in master data.
One of Saltwater/Brackish Water/Fresh Water. Affects the water density.
Water Density
Hidden by default. Density of the water at port. Higher value increases intake.
Bunker reduction (Arriving)
Amount of bunker reduction on arrival in metric tonnes.
Bunker reduction (Departing)
Amount of bunker reduction on departure in metric tonnes.
Quantity on board (Arriving)
Amount of cargo on board on arrival in metric tonnes.
Quantity on board (Departing)
Amount of cargo on board on departure in metric tonnes.
Safety Margin
Hidden by default. Safety margin for the draft. Default value is 20%. Lower value increases intake.
Constant Reduction
Hidden by default. Intake constant reduction of the vessel. Lower value increases intake.
Fresh Water Reduction
Hidden by default. Intake fresh water reduction of the vessel. Lower value increases intake.
FO ROB Voyage Start
Fuel oil at voyage start
LS MGO ROB Voyage Start
Low-sulphur marine gas oil at voyage start
MGO ROB Voyage Start
Marine gas oil at voyage start
LS FO ROB Voyage Start
Low-sulphur fuel oil at voyage start
Port
Name of the port
Reason for call
Tells you the reason for the port call.
Arrival
Shows you date and time for arrival at the port.
Departure
Hidden by default. Shows you date and time for departure from the port.
Draft
Intake draft reduction of the vessel. Lower value increases intake.
Zone
Sets the vessel DWT that is used in the calculation.
Water Salinity
With the Sensitivity Analysis tool you can run calculations on a chosen parameter to evaluate risk.
Click on a voyage in the list or board to open it in the drawer.
At the top right, click on Functions.
Select Voyage Sensitivity Analysis.
Select a voyage parameter which is then adjusted by the numerical variance for each calculation.
The chart shows all the calculated values for the voyage. There are 15 data points, with the current voyage displayed in the middle, with negative variance on the left side, and positive variance on the right side.
The value of the selected Voyage is specified with a blue vertical line. The figures you find in a small box above each point reflect the X-axis values for each point.
Hover the mouse over the chart to inspect the values of each calculation data point.
Moreover, you may find a table on the right from the Sensitivity Analysis chart. The table consists of the calculated values, placed in ascending order. The table may ease navigation among calculations.
Press the menu iconto download the chart as an image (SVG or PNG), or a text file (CSV) that can be imported into spreadsheet software.
Parameter
Calculated value
Freight Rate
TCE
Bunker Price / MT (DO, LS DO, FO, LS FO)
TCE
TCE
Freight Rate

The VMS provides powerful voyage tools for risk assessment and estimations on cargo capacity on port calls.
These tools are available from Voyages or Planning -> Fleet Plans
Click on a voyage in the voyages list or board to open it in the drawer.
At the top right, click on Functions .
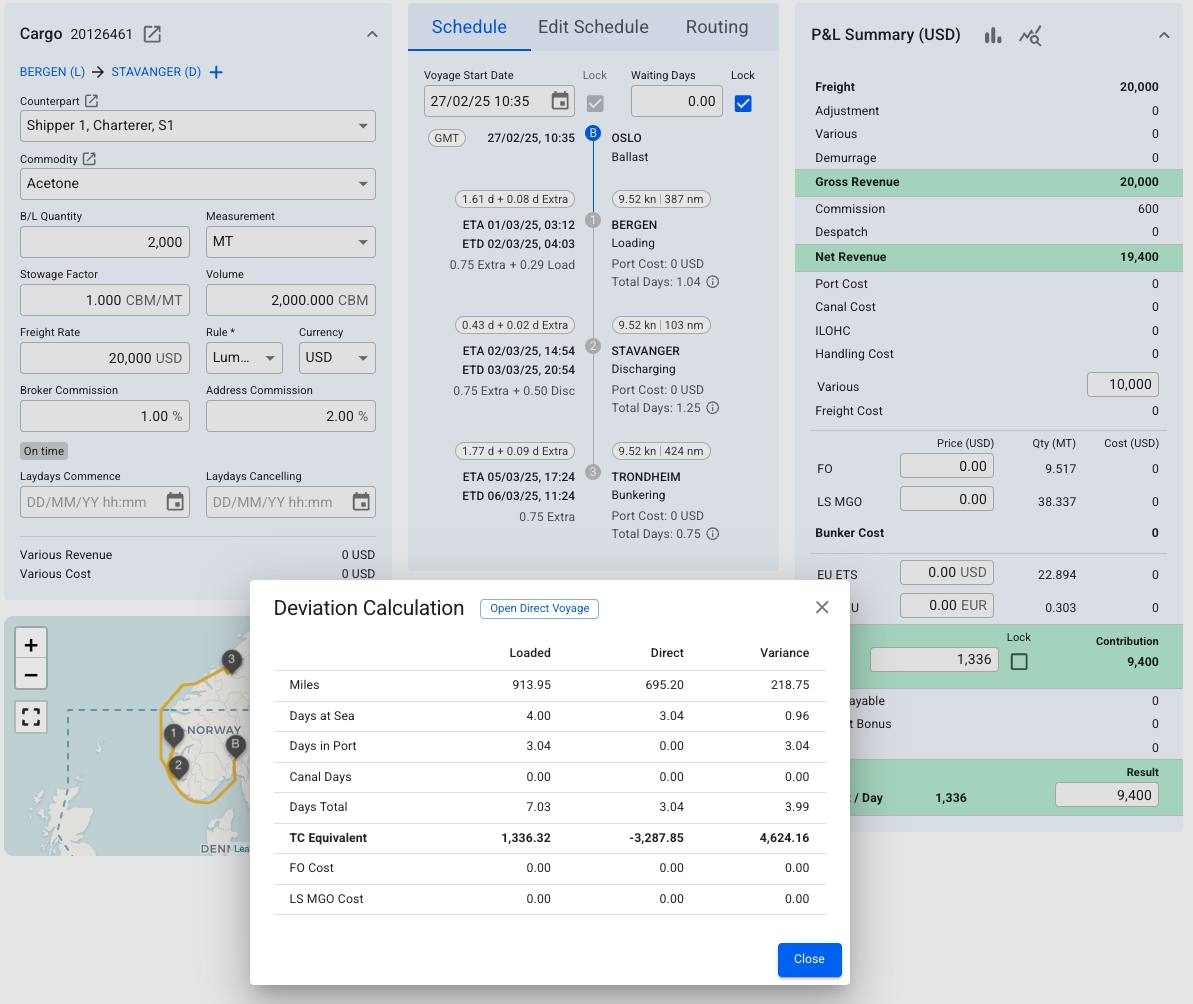
This page provides a detailed explanation of a Voyage Function - Deviation calculation.
The deviation calculation function offers a comprehensive analysis of the difference between the current voyage and the same voyage as if it were direct — from the ballast port to the last port call.
This function is particularly useful when freight rates are low, voyages must adhere to strict schedules, or deviations are required for compliance. It helps determine whether an additional detour can generate enough extra revenue to offset the added distance, time, emissions, and fuel costs.
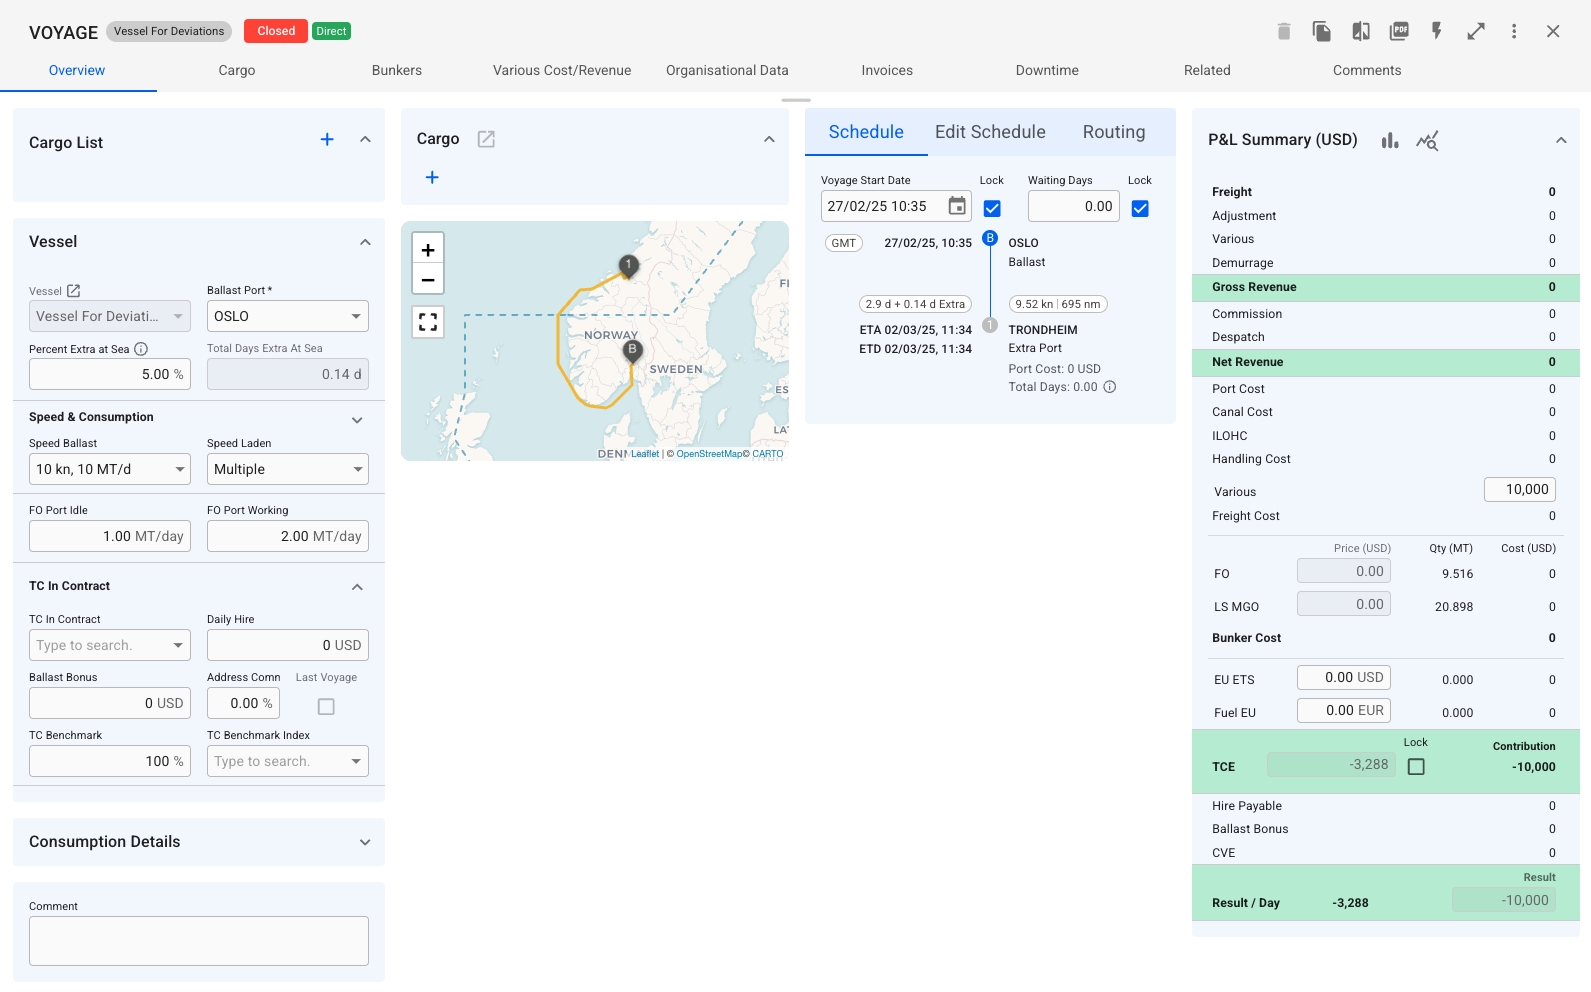
Figure 1 shows the Deviation Calculation window, comparing the current voyage results (in the Loaded column) with a hypothetical direct voyage (in the Direct column). The Variance column highlights the differences between the two. By clicking Open Direct Voyage, users can review the direct route’s details (Figure 2). In this example, the detour with cargo generates higher revenue, making it a more favourable option.
The Deviation Calculation function is available only for Estimate Voyages.